Real Life Page Speed Insights
Measure The Performance of Your Webisite Based On Real User Visits
Open Dashboard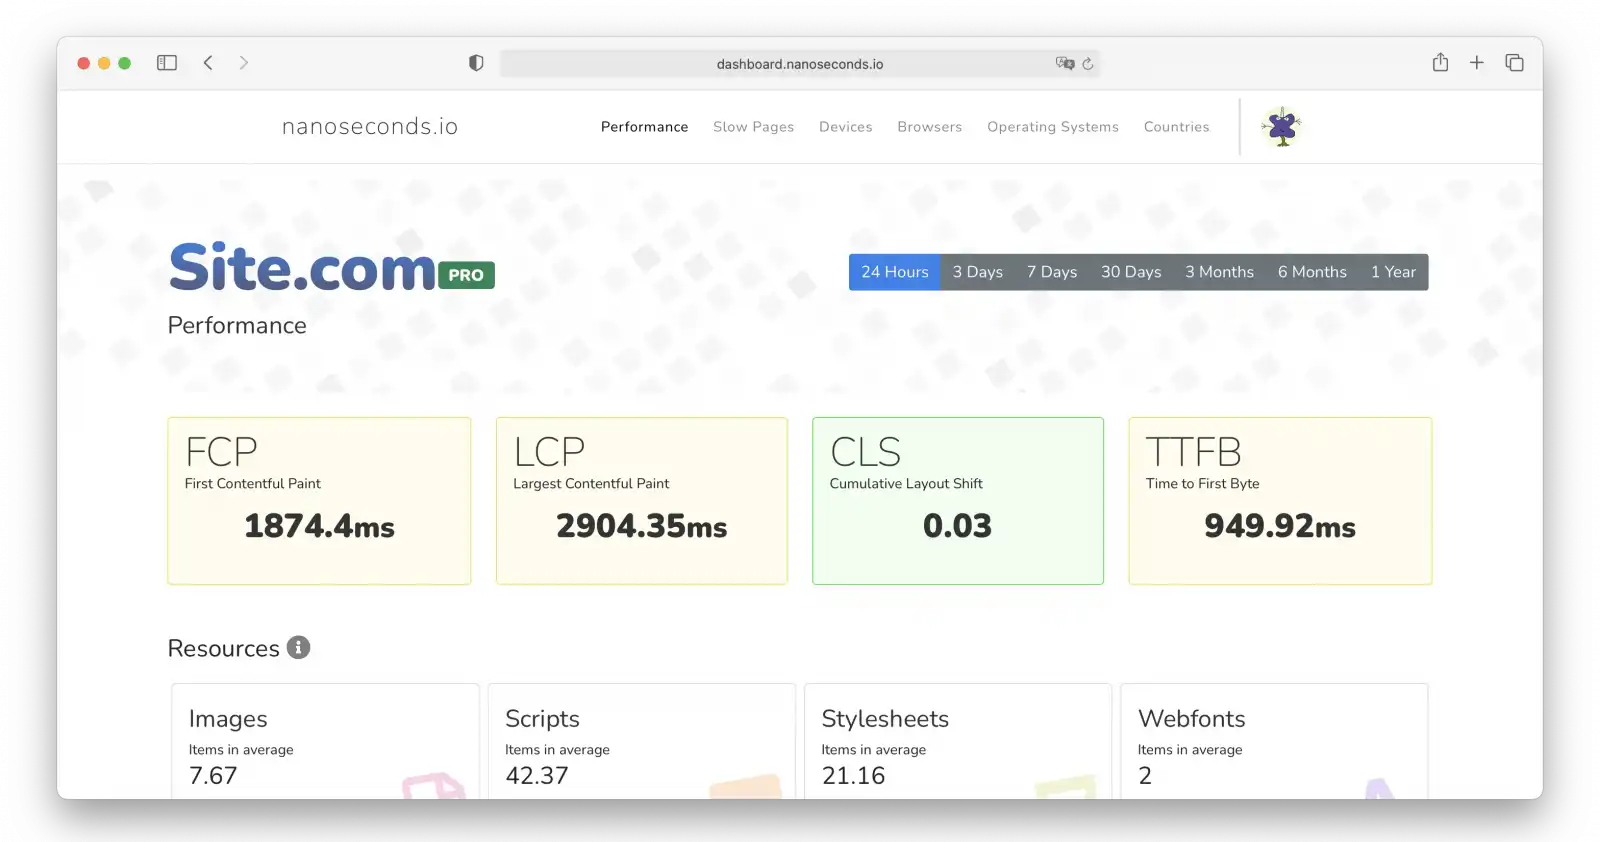
Why Nanoseconds.io?
- Easy install - 1 line HTML only
- Cookie free, we don't identify users
- Lightweight and small script, does not affect on page speed score
Start Measure Your Websites Now!
Register now and add an unlimited amount of websites, it's free! Enjoy the nanoseconds.io dashboard, explore your data visualized on charts and detect weak points of your websites.
Detect Slow Pages
Nanoseconds.io brings an easy way to detect slow pages of your website, with just 1 click you will see which pages were loaded slowly today or in the past.
All reported pages, as well as any URL of the website, can be pasted and explored deeper. We track all requests, so vitals and resource usage can be monitored per each page.


Regional Analysis
Easily detect regions or countries where the website had poor performance.
For instance, In the given example below, we easily can see that the website had lower TTFBs in Europe (especially France, Austria, Ukraine),
relatively poor in South America (Peru and Brazil), and very poor in China.

